
Loading ...
Every application benefits company management only to the extent that it can report business intelligence data. Documenos® presents data in the format you need. From data to decisions: your reporting solution is Documenos®
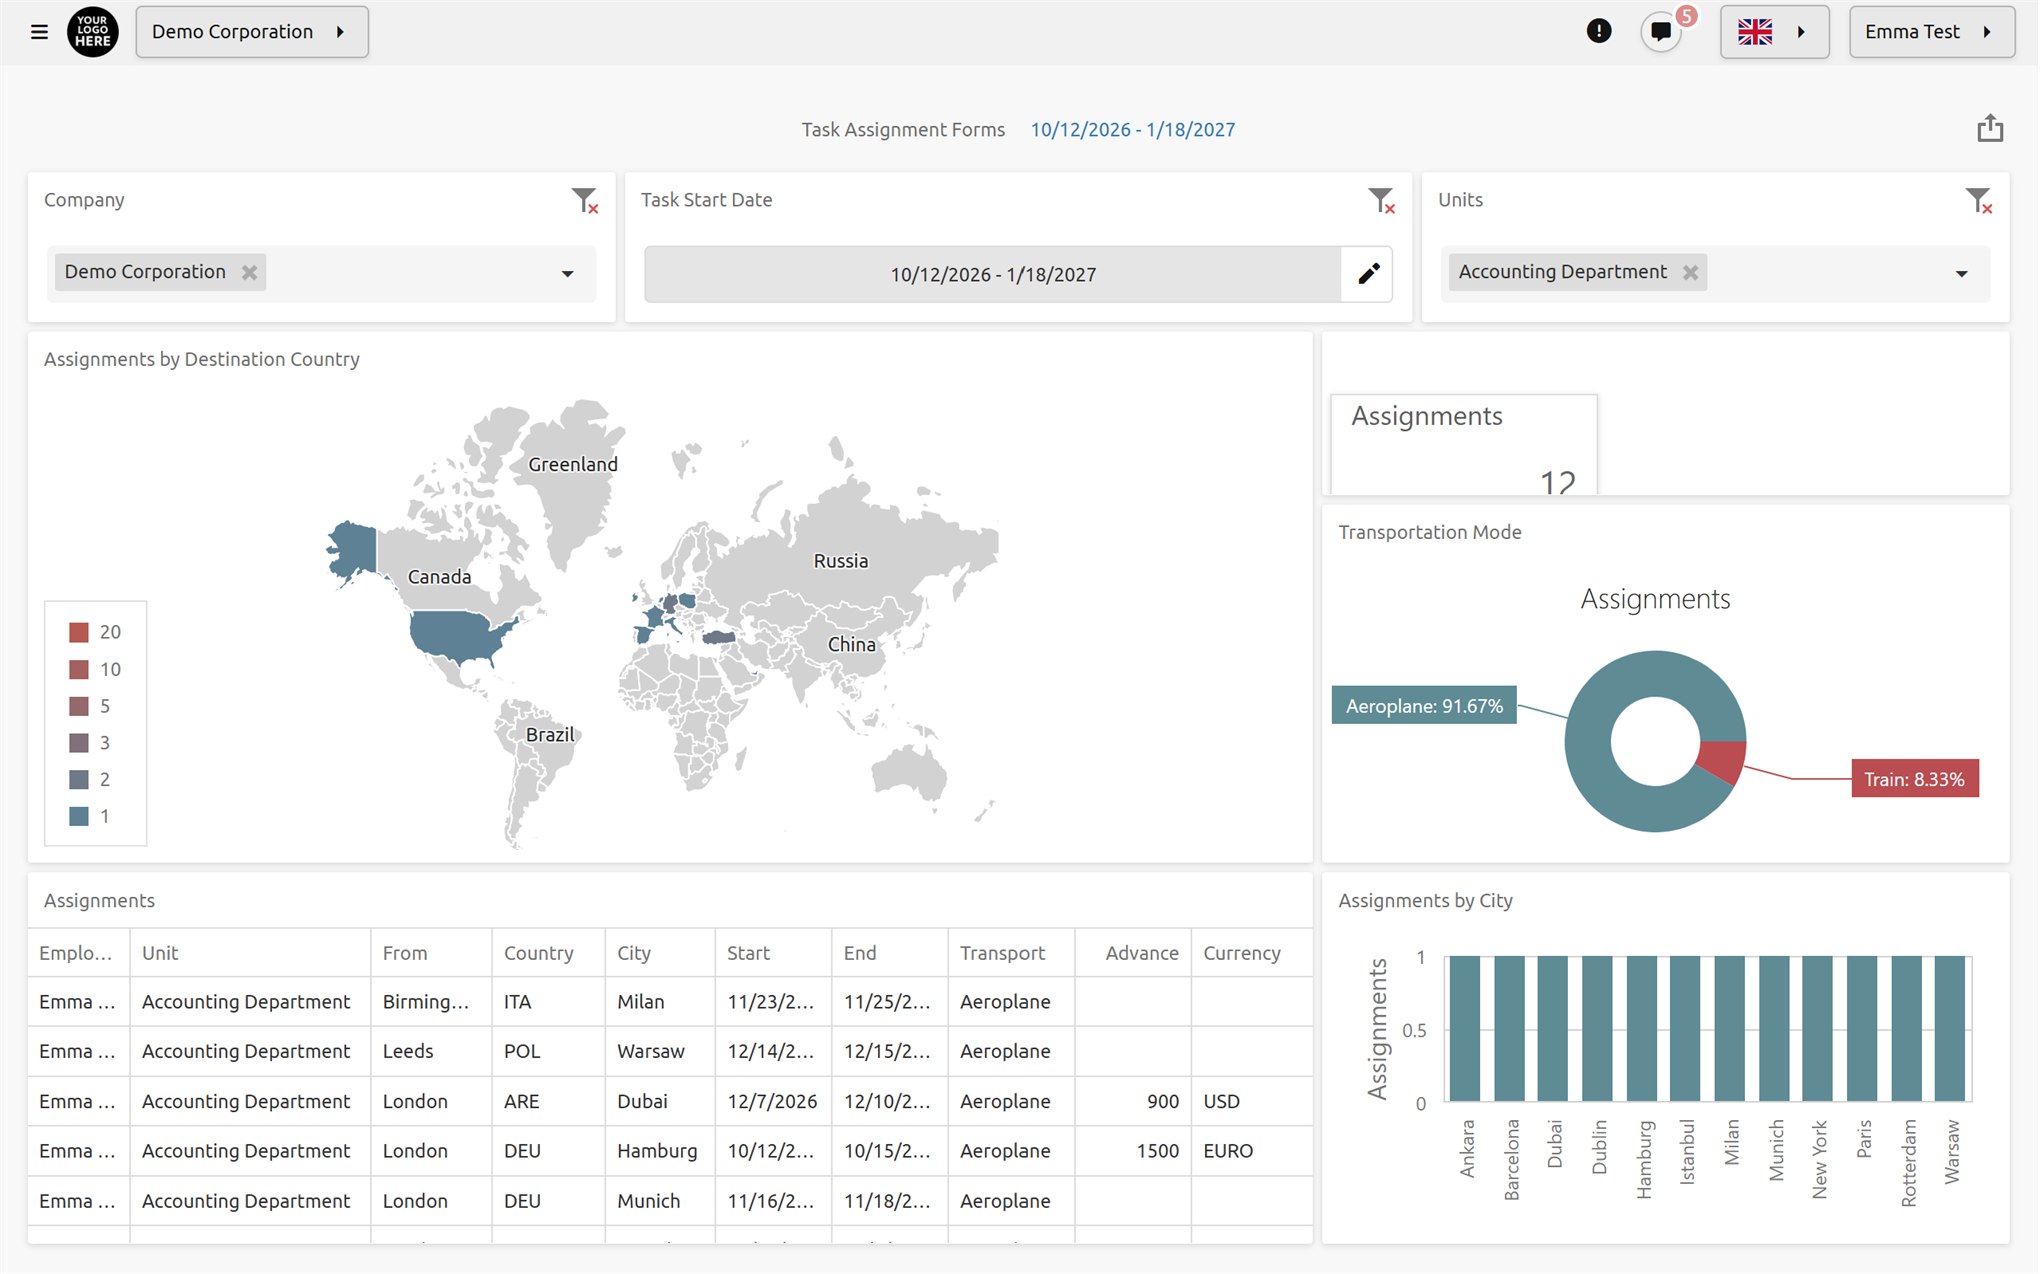
Documenos® BI Reports Dashboard components let you deploy an all-in-one solution and switch between Viewer and Designer modes directly in the web client.

Grid, pivot, chart, pie, treemap, gauge, card and map panels are dragged from the toolbox onto the page and linked together with range, date, list and tree filters.

Alongside the Documenos BI database, MS SQL, MySQL/MariaDB and PostgreSQL databases as well as Excel, text, XML and JSON files can be used as sources. Queries are built with a visual query designer.

World and continent maps come ready to use. For country and city-level visualisation, the organisation can use its own map data.

Dashboard pages marked as published can be embedded in any website with an Iframe code. The page is shown only on sites at the allowed addresses.

Dashboard pages can be downloaded as a .dost package and imported into another Documenos installation. Database connections are adapted automatically during import.

Documenos® offers two different PIVOT report sources that give you daily and monthly totals of the operations performed in the Archive module.

With the archive content summary report, Documenos® archives show in real time how many items each archive contains and how much space they occupy in total.

All Documenos® archives are displayed together as a pie chart in the archive statistics report, according to the percentage of space they occupy.

Documenos® stores the content and header fields of all documents produced in the document and process module (as free text or from form templates) as statistical data and lets you analyse them.

All header data from Documenos® process files can be analyzed in the PIVOT table.

All data obtained from Documenos® workflows can be analysed in a PIVOT table.



With Documenos® Dashboard components, you can personalise your data through a drag-and-drop interface and easily track key KPIs.

By clicking the Export button, the entire page content can be downloaded in PDF, PNG or XLSX format from both the design and viewing screens.

Users need the “Can Edit Data Dashboards” permission to define or design a data dashboard page or edit existing pages. Who can view each page is specified individually.

Thanks to the filters defined in the data dashboard, you can instantly reach the data you want to see.